Be Magnetic To Minimize Customer Loss & Maximize Customer Satisfaction

By Nicole Haskins
VP, Paymentus
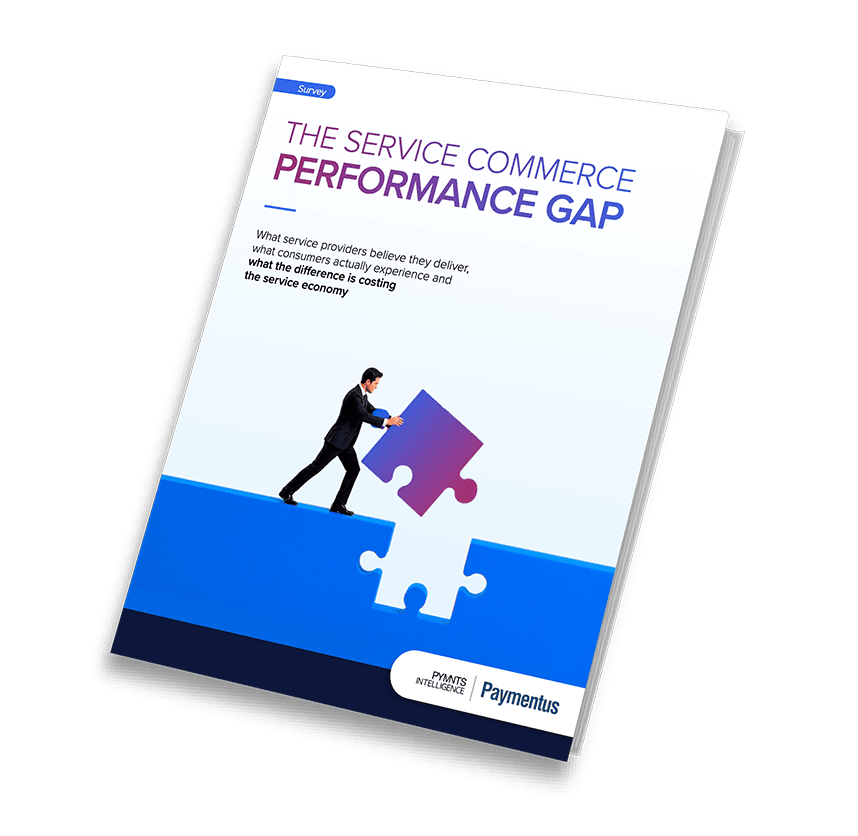
Recently, Paymentus and PYMNTS Intelligence partnered on an unprecedented report—The Service Commerce Performance Gap—that exposes the growing divide between what service providers believe they deliver through their billing and payments, and what consumers actually experience.
Throughout its development, a host of data points have made two things clear:

Consumers of all ages are generally dissatisfied with the billing and payment experience offered by their service providers.

Service providers control the levers of improvement but are either unaware of the issues at hand or lack a focus on the proper fixes.
Addressing this second point is what will separate the pacesetters (those leading the pack) from the challengers (those furthest behind but with the most room to grow). To address this point, however, service providers must be honest in assessing their capabilities and how they impact satisfaction and loyalty.
One of the most glaring examples of this comes in the form of something for which most providers blame external factors: customer churn and customer loss.
Understanding Churn Dynamics
There are many reasons customers may churn, but the underlying fact is that churn is the result of continuous dissatisfaction, not generally a reaction to a one-off event. Given its recurring nature, billing and payments serve as either the ultimate loyalty-driver or a relationship wedge.
The data* highlights where this risk concentrates. Those most likely to churn express satisfaction scores well below those of consumers who are content to stay. In particular, consumers who say that paying bills is harder than a retail checkout score 15 points below their counterparts on satisfaction.
The most troublesome part is that churn is highest among Gen Z, the youngest generation of bill payers who also have the longest bill-paying lifetime ahead of them. While Baby Boomers almost uniformly say they are unlikely to switch service providers due to billing and payment dissatisfaction, Gen Z is directly opposite. For example, 38% of Gen Z customers would switch electric and gas companies if they could.
Electric and gas companies are often treated as afterthoughts when service is uninterrupted, and yet, nearly 40% of younger customers would consider switching. That is the power of the billing and payment experience.
Service Providers Are Too Quick to Blame External Forces
The self-assessment offered by several hundred service providers as part of this report provides an interesting view into how churn can become pervasive:
- 65% of service providers say they understand their churn but only 19% back that claim with data
- 84% of providers with rising churn rely on general impressions or partial visibility rather than hard analysis
Without reliable analytics, providers are left to guess at which factors most impact churn. Their guesses almost inevitably place the blame on factors perceived to be outside of their control:
- Life events and external factors (89%)
- Price increases (77%)
- Competitor pricing (65%)
The factors within their control—payment flexibility, billing and payment friction, poor digital experience, and support issues—all cluster at the bottom of the findings. The consumer data, however, shows that these controllable factors directly drive churn. As is stated in the report, the attribution gap itself is a barrier to action.
Delayed Payments Are Just Churn by Another Name
Lest you think churn is something that impacts only those in competitive markets, our data proves otherwise.
The depth and breadth of Paymentus’ reach place us in the enviable position of serving thousands of organizations responsible for the bill-paying needs of millions of North American consumers. Our client verticals run the gamut from highly competitive to monopoly-like. Regardless of vertical competition, there is always revenue at stake.
For many, churn represents lost revenue in the form of customers. For others such as utilities and tax departments, low churn is about lock-in, not loyalty. In these verticals, dissatisfaction is expressed through payment delays, which account for nearly $28 billion per month in revenues arriving past a bill’s due date.
This is real cash flow being denied due to customers having no other recourse to address their unhappiness. Whether competing for customer retention or on-time revenue, it’s vital that all service providers realize that they are always competing for priority when it comes to receiving their money.
To help improve performance, we recommend that all service providers place a focus on studying their customer churn from a billing and payment perspective. By analyzing internal factors first, you can solidify your most recurring customer touchpoint and optimize the end-to-end billing and payment experience. Even if external factors do impact churn, modernizing your customer experience can blunt the impact, increase on-time payments, and strengthen relationships.
Paymentus is here to help guide your Service Commerce journey. Contact us today to request your copy of the upcoming Service Commerce Gap report once available. You can also learn more by visiting our Service Commerce solution page.
*All data courtesy of “The Service Commerce Performance Gap”, PYMNTS Intelligence, March 2026, unless otherwise noted.